Senior IP decision-makers, specifically Chief Intellectual Property Officers (CIPOs), and partners at law firms and in-house counsel advising the ASX 200 companies, should read this article to understand:
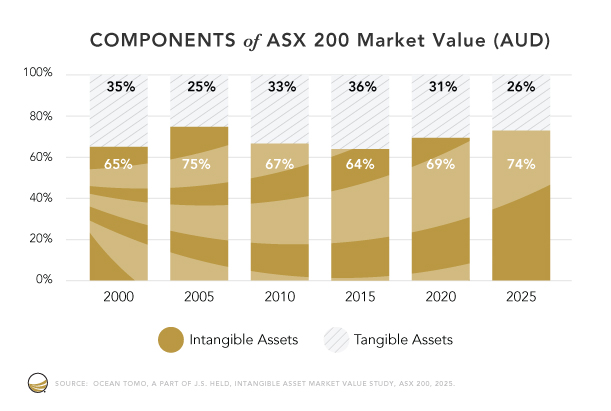
- Australia’s intangible share and its 25-year trajectory. Intangible assets rose from about 65.5% of ASX 200 market capitalization in 2000 to a record 74% in 2025, a nine-percentage-point increase.
- Where Australia sits globally. The ASX 200’s 74% falls below the US S&P 500 and Europe’s S&P Europe 350, but well above Japan’s Nikkei 225, South Korea’s KOSDAQ, and China’s CSI 300 — with commodity exposure explaining the more gradual Australian climb versus the S&P 500’s move from 32% in 1985 to 80% in 2005.
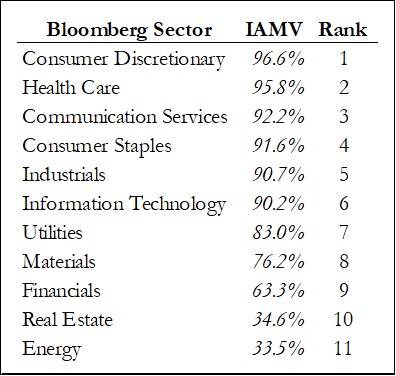
- Which sectors drive the number. Healthcare, Communications Services, and Information Technology are intangible-dominant, while Energy anchors the index in tangible assets.
- How macro shocks move IAMV. The Global Financial Crisis compressed IAMV to roughly 66.8% by 2010 as markets reassessed goodwill, followed by a decade of consolidation and then post-pandemic acceleration from 69.1% in 2020 to 74% in 2025.
- Why AI raises the stakes for intangible asset governance. AI is creating new intangible asset categories — proprietary models, training data, AI-generated IP — while accelerating obsolescence of existing ones, and evolving AI, data privacy, and digital markets regulation creates a compliance landscape CIPOs must navigate without impairing asset value.
Executive Summary
This article focuses on the Intangible Asset Market Value in the Australian Equity Market, using Ocean Tomo’s ASX 200 IAMV dataset to show that intangible assets grew from roughly 65.5% of Australian market capitalization in 2000 to a record 74% in 2025. This places the ASX 200 above Japan, China, and South Korea but below the US S&P 500 and Europe’s S&P Europe 350. Sector detail explains the more gradual Australian trajectory. Healthcare, communications, and information technology are intangible-dominant, while resource-heavy sectors such as Energy and Materials anchor the index in tangible assets. The article concludes that intangible asset stewardship is now a core leadership responsibility of the Chief Intellectual Property Officer (CIPO), intensified by AI, creating new intangible asset categories while accelerating obsolescence and regulatory complexity.
Introduction
The Australian Securities Exchange has undergone a fundamental transformation over the past quarter-century, mirroring the “economic inversion” documented across developed markets wherein corporate value has migrated from tangible to intangible assets. Ocean Tomo’s ASX 200 Intangible Asset Market Value (IAMV) dataset reveals that intangible assets represented approximately 65.5% of market capitalization in 2000, equivalent to AUD 365.7 billion, and climbed to over 74% by 2025, corresponding to less than AUD 2.44 trillion of implied intangible value.1 This trajectory closely parallels other IAMV findings, confirming that Australia is deeply embedded in the global knowledge economy where intellectual property, data assets, brand equity, and organizational capabilities drive corporate valuation.
Australian regulators have independently confirmed this structural shift. The Australian Securities and Investments Commission states that listed companies have become less capital-intensive as intangible assets assume greater roles in value creation, thereby complicating traditional valuation approaches and elevating the importance of technical expertise in equity market interpretation.2
Trends, Sectors, and Volatility in the ASX 200
The ASX 200’s 25-year IAMV record reveals a multi-phase transition characterized by progressive intangible asset predominance punctuated by macroeconomic shocks. From the 2000 baseline of 65.5%, IAMV rose above 70% by the mid-2000s as digital capabilities, advanced services, and brand-centric business models expanded. The Global Financial Crisis temporarily compressed IAMV to approximately 66.8% by 2010 as markets reassessed goodwill and intangible asset valuations on financial institutions’ and other companies’ balance sheets. The decade from 2010 to 2020 represented a consolidation phase, with IAMV fluctuating between the mid-60% to 70% range despite commodity price volatility.3 Additionally, Australia experienced notable domestic policy shifts during the decade. This includes the introduction of a national carbon pricing mechanism in 2012 and its repeal in 2014, which reflects significant changes in the country’s regulatory and economic policy environment.4 Intangible value expansion accelerated dramatically since the COVID-19 pandemic began: IAMV climbed from 69.1% in 2020 to 71.9% in 2024 and reached its highest recorded level of 74% in 2025. Below are sector highlights relating to the contributing industries to the ASX 200 IAMV study, as well as a summary of IAMV for each sector:
Financial services represent one of the largest contributors to aggregate ASX 200 IAMV, with Australia’s major banks – Commonwealth Bank, NAB, Westpac, ANZ, and Macquarie5 – deriving substantial value from customer relationships, regulated deposit franchises, sophisticated risk analytics, and large-scale digital infrastructures.6 IAMV calculations frequently show intangible assets value at or above 50% for leading banks, and approximately 63% for the Financials sector overall at the end of 2025.7
Healthcare and life sciences constitute another sector with high IAMV. ASX 200 firms such as Cochlear rely heavily on IP such as proprietary technology, clinical know-how, manufacturing processes, and expansive R&D programs, with IAMV data showing persistently elevated intangible ratios that reflect patent-based and regulatory moats.8 Overall, the Healthcare sector exhibited an IAMV share of almost 96% as of the end of 2025.
Technology and digital platform companies such as REA Group and Xero operate business models that are heavily dependent on software, data, brands, user networks, and other intangible assets. Market analysis by Market Index and the Australian Shareholder’s Association attributes the ASX 200’s 2025 gains in part to “the still-soaring [artificial intelligence] thematic” and “AI-drive optimism,” respectively.9 Other contributing factors include robust digital business models, aligning with global IAMV findings that software, platforms, and data-based business models generate high-quality intangible assets that can be leveraged across large user bases at relatively low marginal cost.10 As of December 31, 2025, the Information Technology and Communications Services sectors commanded a 90% and 92% IAMV share, respectively, at the end of 2025.
Resources and industrials (a key Australian sector), by contrast, remain more tangible-asset intensive. Mining majors such as BHP and Rio Tinto exhibit lower IAMV ratios, reflecting substantial physical asset bases, yet still possess significant intangible value in operational know-how, mine-planning algorithms, geological data, and resource rights. Even in portfolios with particular emphasis on resources, intangible capabilities such as process technology and risk management materially influence overall valuation. The Materials and Energy sectors at the end of 2025 accounted for approximately 76% and 34% of IAMV, respectively.
Australia’s 74% IAMV as of 2025 positions the ASX 200 between the US S&P 500 (92%) and Europe’s S&P Europe 350 (77%) on the high-end, while substantially exceeding Japan’s Nikkei 225 (52%), China’s CSI 300 (25%), and South Korea’s KOSDAQ (approximately 50%). The ASX 200’s IAMV trajectory from 65% in 2000 to 74% in 2025 represents a 9-percentage-point increase over 25 years, a more gradual progression than the US S&P 500’s explosive acceleration from 32% in 1985 to 80% in 2005, likely reflective of Australia’s significant exposure to commodity sectors, which exhibit structurally lower IAMV ratios than pure technology or platform businesses.
Australia’s Position and Future Trajectory
The ASX 200 IAMV trajectory confirms that intangible asset management is now central to enterprise strategy, risk oversight, and valuation in Australia. For Chief Intellectual Property Officers (CIPOs), this creates both an obligation and an opportunity: to ensure that the intangible capital driving the majority of corporate value is systematically identified, protected, and aligned with the interests of long-term stakeholders. With 74% of ASX 200 value residing in intangible assets, the protection, development, and strategic deployment of these assets is not a support function but the central challenge of Australian corporate leadership in the 21st century.
Looking ahead, several forces are likely to intensify the strategic importance of intangible asset management in Australia. Artificial intelligence (AI) is simultaneously creating new categories of intangible assets (e.g., proprietary models, training data, AI-generated IP) and threatening existing ones through accelerating obsolescence cycles. Regulatory frameworks for AI, data privacy, and digital markets continue to evolve across jurisdictions, creating a dynamic compliance landscape that CIPOs must navigate without impairing intangible asset value.
The IAMV framework provides the empirical foundation, analytical tools, and strategic vocabulary to meet these challenges. Economic value has migrated from what can be “touched” to what can be “thought,” and Australia’s continued prosperity depends on corporate leadership’s capacity to protect, develop, and enhance the intangible assets that now constitute the overwhelming majority of corporate worth in a complex and rapidly evolving global environment.
1IAMV is shown as of calendar year end by subtracting net tangible asset value from market capitalization.
2“REP 807 Evaluating the state of the Australian public equity market: Evidence from data and academic literature – HTML version,” ASIC, February 2025, https://www.asic.gov.au/regulatory-resources/find-a-document/reports/rep-807-evaluating-the-state-of-the-australian-public-equity-market-evidence-from-data-and-academic-literature/rep-807-evaluating-the-state-of-the-australian-public-equity-market-evidence-from-data-and-academic-literature-html-version/; “Driving competitive advantage through intangible investments,” UNSW Sydney BusinessThink, December 4, 2024, https://www.businessthink.unsw.edu.au/articles/intangible-assets-business-value-creation.
3“Chart Pack – Commodity Prices,” Reserve Bank of Australia, June 17, 2026, https://www.rba.gov.au/chart-pack/commodity-prices.html; Devlin, W., Woods, S., & Coates, B., “Commodity price volatility,” 2010, https://treasury.gov.au/sites/default/files/2019-03/01_Commodity_price_volatility.pdf.
4“Chapter 3: The Clean Energy Package and the impact of its proposed repeal,” Parliament of Australia, https://www.aph.gov.au/parliamentary_business/committees/senate/environment_and_communications/direct_action_plan/report/c03.
5D. Whittleston, “ASX Financials Sector Analysis,” The Investor Standard, July 3, 2026, https://theinvestorstandard.com.au/2026/07/03/asx-financials-sector-analysis-2026/.
6“2025 Annual Report,” Commonwealth Bank of Australia, August 13, 2025, https://www.commbank.com.au/content/dam/commbank-assets/investors/docs/results/fy25/2025-annual-report.pdf.
7“Intangible value contribution to the ASX 100,” Deloitte IP Advisory, 2023.
8“Annual Report 2023,” Cochlear Limited, August 15, 2023, https://assets.cochlear.com/api/public/content/db4f441469aa4263acccdfc23980d21b?v=ce8bbd15; Peters, S. & Winters, M., “Investor Perspectives: Intangible Assets,” CFA Institute Research & Policy Center, February 2025, https://rpc.cfainstitute.org/sites/default/files/docs/surveys/intangibles-report_online.pdf; “Intangible Asset Market Value Study,” Ocean Tomo, 2026, https://oceantomo.com/intangible-asset-market-value-study/.
9K. Sun, “The best and worst performing ASX 200 stocks in every sector for FY25,” Market Index, July 1, 2025, https://www.marketindex.com.au/news/the-best-and-worst-performing-asx-200-stocks-in-every-sector-for-fy25; “ASX 200 Delivers 9.97% in 2024/25: ASA’s Review of Top and Bottom Performers,” Australian Shareholders’ Association, July 1, 2025, https://www.australianshareholders.com.au/asx-200-delivers-9-97-in-2024-25-asas-review-of-top-and-bottom-performers/; “Australia Artificial Intelligence Market,” International Trade Administration, June 27, 2024, https://www.trade.gov/market-intelligence/australia-artificial-intelligence-market.
10K. Sun, “The best and worst performing ASX 200 stocks in every sector for FY25,” Market Index, July 1, 2025, https://www.marketindex.com.au/news/the-best-and-worst-performing-asx-200-stocks-in-every-sector-for-fy25; “ASX 200 Delivers 9.97% in 2024/25: ASA’s Review of Top and Bottom Performers,” Australian Shareholders’ Association, July 1, 2025, https://www.australianshareholders.com.au/asx-200-delivers-9-97-in-2024-25-asas-review-of-top-and-bottom-performers/; “Australia Artificial Intelligence Market,” International Trade Administration, June 27, 2024, https://www.trade.gov/market-intelligence/australia-artificial-intelligence-market.
Transparency Statement: Artificial intelligence tools were used to support the development of this thought leadership content, which could include research support, information synthesis, and editorial refinement. The analysis, insights, perspectives, and conclusions presented are those of the author(s) and reflect their professional expertise and judgment. The content was reviewed by the author(s) for accuracy, relevance, and consistency with the source materials. Artificial intelligence tools did not independently determine the content’s conclusions or recommendations.